
Sewage Spills & Sewer Flooding Across South London & Surrey: 2022-2025
Two datasets, one sewer network under the same pressure. In 2025, storm overflows discharged sewage into rivers and brooks across the region 250 times. Over the three years to March 2025, the same network backed up into 420 homes and gardens. We mapped both, from official Environment Agency and Thames Water figures.
Storm overflow spills and sewer flooding are usually reported as separate stories, but they come from the same combined sewers, sized for a smaller town than the one now running through them. This report covers both: where sewage spilled into rivers in 2025, and where the sewer network flooded homes and gardens between 2022 and 2025.
Sewage spills into rivers, 2025
Every one of the monitored storm overflows below is operated by Thames Water, which the Environment Agency rated the worst-performing water company in England in its 2024 assessment. The company discharged raw sewage for 298,081 hours nationally that year, up 51% on 2023. The 2025 figures below are the most recent full-year data, released in 2026.
Sewage spills by area, 2025
Ranked by total discharge duration. Bars show hours relative to the worst-affected area.
| Area (constituency) | Spills | Hours | Worst overflow site |
|---|---|---|---|
| Epsom & Ewell | 55 | 801 | Leatherhead WWTW → River Mole |
| Reigate & Redhill | 61 | 556 | Earlswood Brook (Earlswood WWTW) |
| Mitcham & Morden | 125 | 204 | Streatham & Balham Storm Relief → Graveney |
| Carshalton & Wallington | 5 | 13 | Beddington Effluent Carrier → River Wandle |
| Croydon East | 4 | 4 | South Norwood CSO → Chaffinch Brook |
| Croydon West | 0 | 0 | Canterbury Rd, Thornton Heath (monitored, no spills) |
| Sutton & Cheam | 0 | 0 | No monitored overflows in constituency |
Figures are counts of discrete spill events and total hours of discharge from Environment Agency Event Duration Monitoring (EDM), calendar year 2025.
The named hotspots
The individual storm overflows responsible for the most discharge in our region during 2025.
Sewer flooding into homes and gardens, 2022-2025
The figures below come from Thames Water's DG5 sewer flooding register, the internal log every water company keeps of flooding caused by its sewer network, for the three financial years 2022/23 to 2024/25. Each row is one recorded incident, dated and matched to a postcode. Caterham (CR3) is not included in the trend figures: Thames Water's reply for that postcode only covered the twelve months to July 2026, not the three-year period we asked for. The full detail, including that gap, is in the Methodology section below.
Sewer flooding by postcode district, 2022 to 2025
Ranked by total incidents over the three years. CR0, in central Croydon, accounts for more than one in five of every incident in the dataset, more than double any other district's three-year total.
All 22 postcode districts we asked about
Full year-by-year breakdown, including districts with very few or no recorded incidents. CR9 is a non-geographic Croydon postcode with no residential addresses, which is why it shows zero throughout.
| Postcode | Area | 2022/23 | 2023/24 | 2024/25 | 3-year total | Change |
|---|---|---|---|---|---|---|
| CR0 | Croydon | 27 | 21 | 47 | 95 | +74.1% |
| CR7 | Croydon | 12 | 10 | 11 | 33 | -8.3% |
| RH2 | Reigate & Redhill | 6 | 12 | 12 | 30 | +100.0% |
| CR2 | Croydon | 9 | 9 | 11 | 29 | +22.2% |
| BR3 | Bromley | 7 | 12 | 5 | 24 | -28.6% |
| BR4 | Bromley | 3 | 5 | 15 | 23 | +400.0% |
| RH1 | Reigate & Redhill | 4 | 4 | 13 | 21 | +225.0% |
| BR5 | Bromley | 3 | 6 | 11 | 20 | +266.7% |
| SM1 | Sutton | 7 | 5 | 5 | 17 | -28.6% |
| BR6 | Bromley | 3 | 4 | 9 | 16 | +200.0% |
| BR2 | Bromley | 2 | 4 | 9 | 15 | +350.0% |
| SM3 | Sutton | 4 | 3 | 8 | 15 | +100.0% |
| SM5 | Sutton | 7 | 3 | 5 | 15 | -28.6% |
| BR1 | Bromley | 2 | 6 | 4 | 12 | +100.0% |
| SM6 | Sutton | 6 | 2 | 4 | 12 | -33.3% |
| KT19 | Epsom & Ewell | 4 | 1 | 7 | 12 | +75.0% |
| SM2 | Sutton | 3 | 2 | 2 | 7 | -33.3% |
| KT18 | Epsom & Ewell | 3 | 1 | 3 | 7 | +0.0% |
| BR7 | Bromley | 1 | 2 | 3 | 6 | +200.0% |
| SM4 | Sutton | 2 | 1 | 2 | 5 | +0.0% |
| KT17 | Epsom & Ewell | 2 | 1 | 2 | 5 | +0.0% |
| SM7 | Sutton | 0 | 0 | 1 | 1 | n/a (from 0) |
| CR9 | Croydon | 0 | 0 | 0 | 0 | n/a |
Figures are incident counts from Thames Water's sewer flooding register, financial years 2022/23 to 2024/25 (1 April to 31 March). Excludes Caterham (CR3, incomplete date range in Thames Water's response) and a small number of records for postcodes bordering Croydon (CR5, CR8, and boundary overlaps into SE19, SE25, SW16, SW18, SW19 and SW20) that fell outside the exact districts named in our request.
Three-year trend by area
Bromley's rise was the steepest of the five areas, more than two and a half times its 2022/23 total by 2024/25. Sutton was the only area where incidents fell over the same period.
Internal versus external flooding
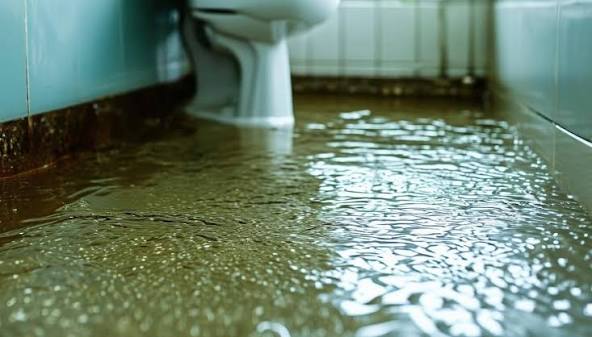
Two in three recorded incidents, 66.4%, flooded outside the property, in a garden or yard. Just under one in five, 18.6%, reached inside a home or business, the more disruptive and costly outcome for the household affected. The remaining 15.0% were logged under categories Thames Water's response did not define, so we have left them unclassified rather than guessing which side of the boundary they fell on.
- Thames Water confirmed it does not yet hold a completed sewer flooding "at risk" register for these areas, so we cannot report how many properties are formally flagged as being at risk.
- Caterham (CR3) is excluded from every trend figure above. Thames Water's own reply for that postcode covers 15 July 2025 to 16 July 2026 only, not the three financial years we requested for every other district.
- Thames Water's Croydon reply included some records for postcodes we did not ask about (CR5, CR8, and a handful crossing into SE19, SE25, SW16, SW18, SW19 and SW20). We have excluded these to keep the Croydon totals strictly within CR0, CR2, CR7 and CR9, as specified in our original request.
Why this happens
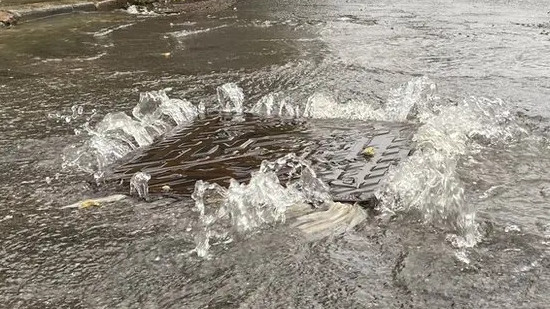
Most of this region sits on Victorian-era combined sewers, pipes built to carry rainwater and wastewater together. When a storm sends more water into those pipes than they can hold, the excess has to go somewhere. Some of it backs up through the nearest drain, manhole or toilet, which is what the sewer flooding data above records. Some of it discharges through a storm overflow into the nearest river, which is what the spill data above records. Different outcome, same cause: too much rain hitting a network sized for a smaller, drier town.
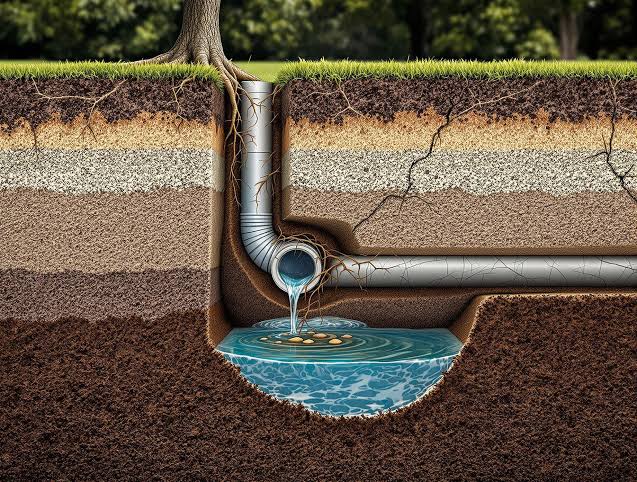
Two things worth keeping in mind when reading either dataset. The sewer flooding figures come from Thames Water's DG5 register, known in the water industry by that name, which only counts flooding caused by its own network, not a blocked private drain, a burst water main, or surface water that never reached a sewer at all. That is a narrower definition than "flooding" in everyday use. The storm overflow figures cover monitored sites only, exactly as recorded in the Environment Agency's Event Duration Monitoring returns.
The public sewer, and the storm overflows it feeds, are Thames Water's responsibility. The drains inside your property boundary are yours, up to the point they meet that public network. A blockage from tree roots or fat, grease and wet wipes on your own drains causes the same symptoms (flooding, slow drainage, sewage smells) even when the public network is coping fine. The only reliable way to tell which side of that boundary a problem sits on is to have the pipe itself checked.
What this looks like on the ground
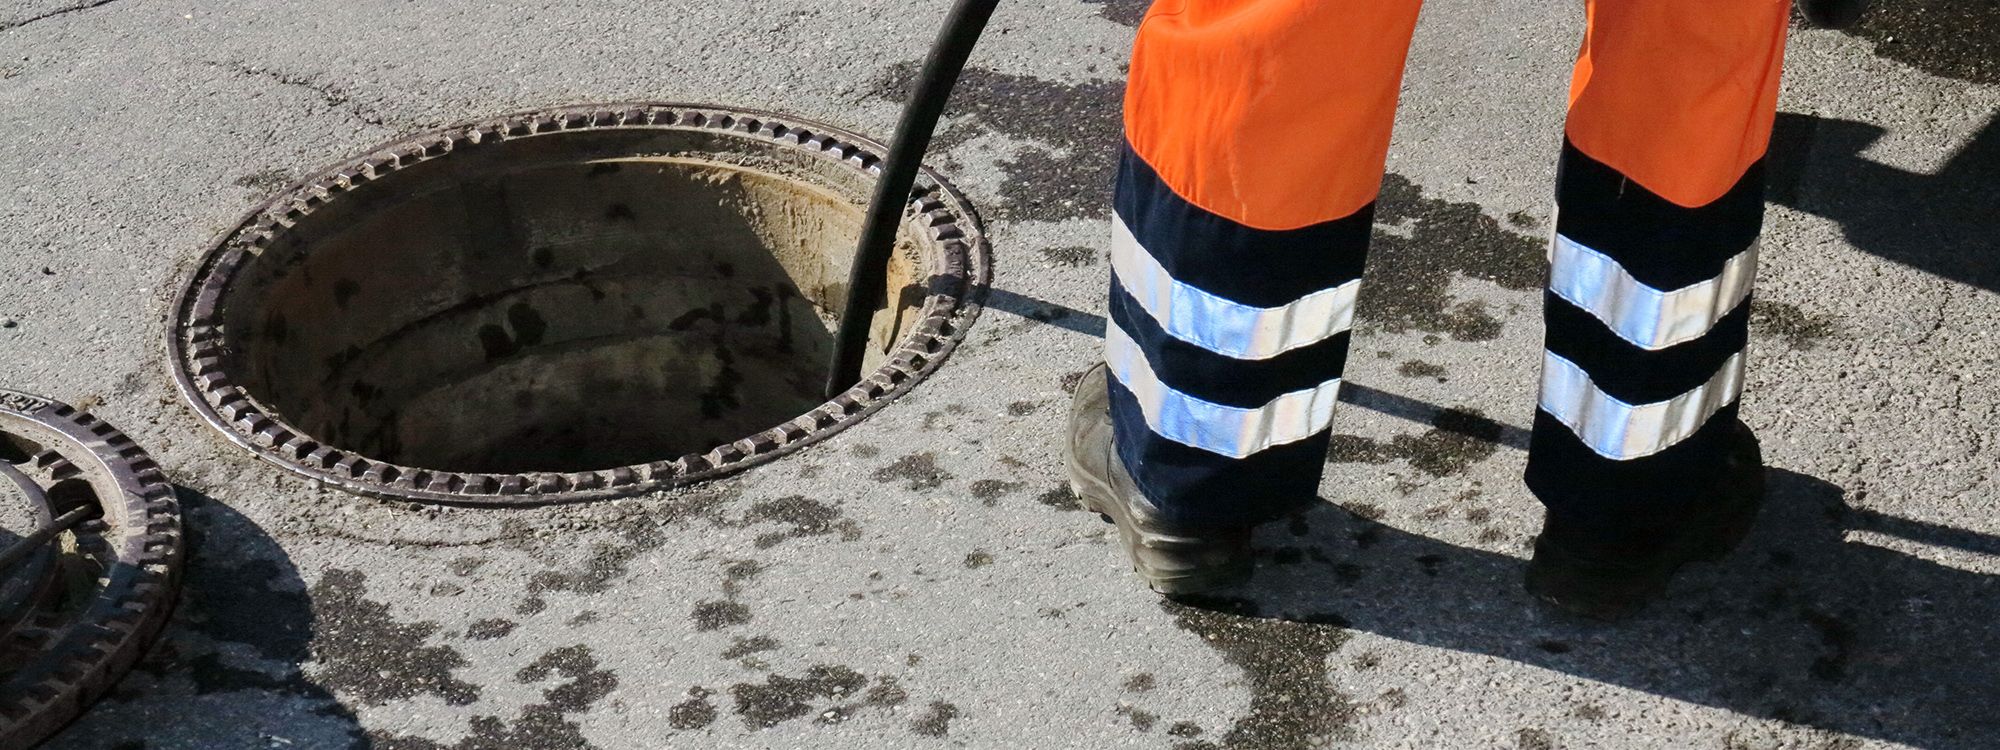
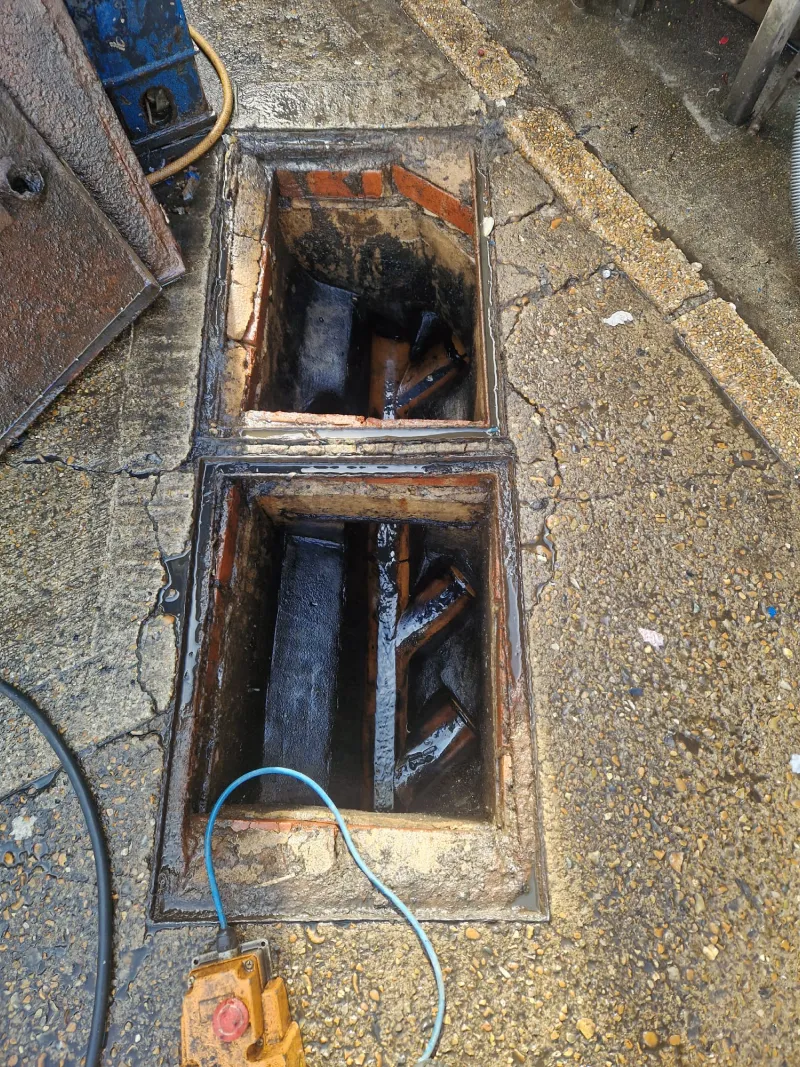
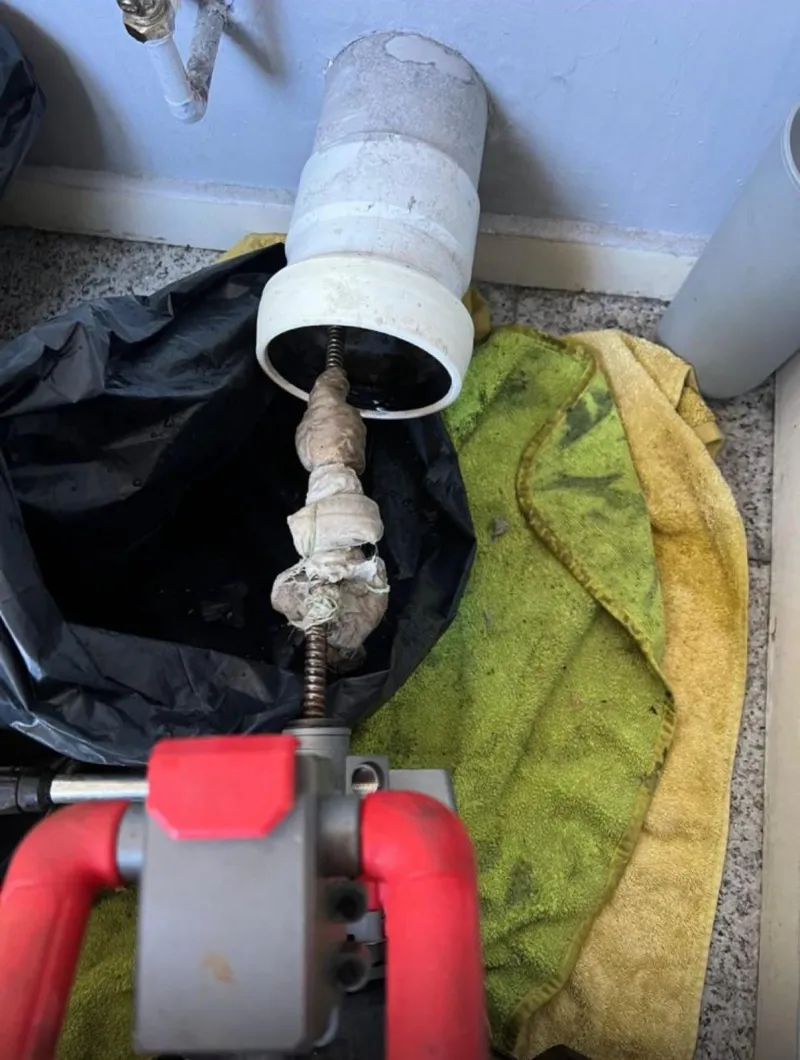
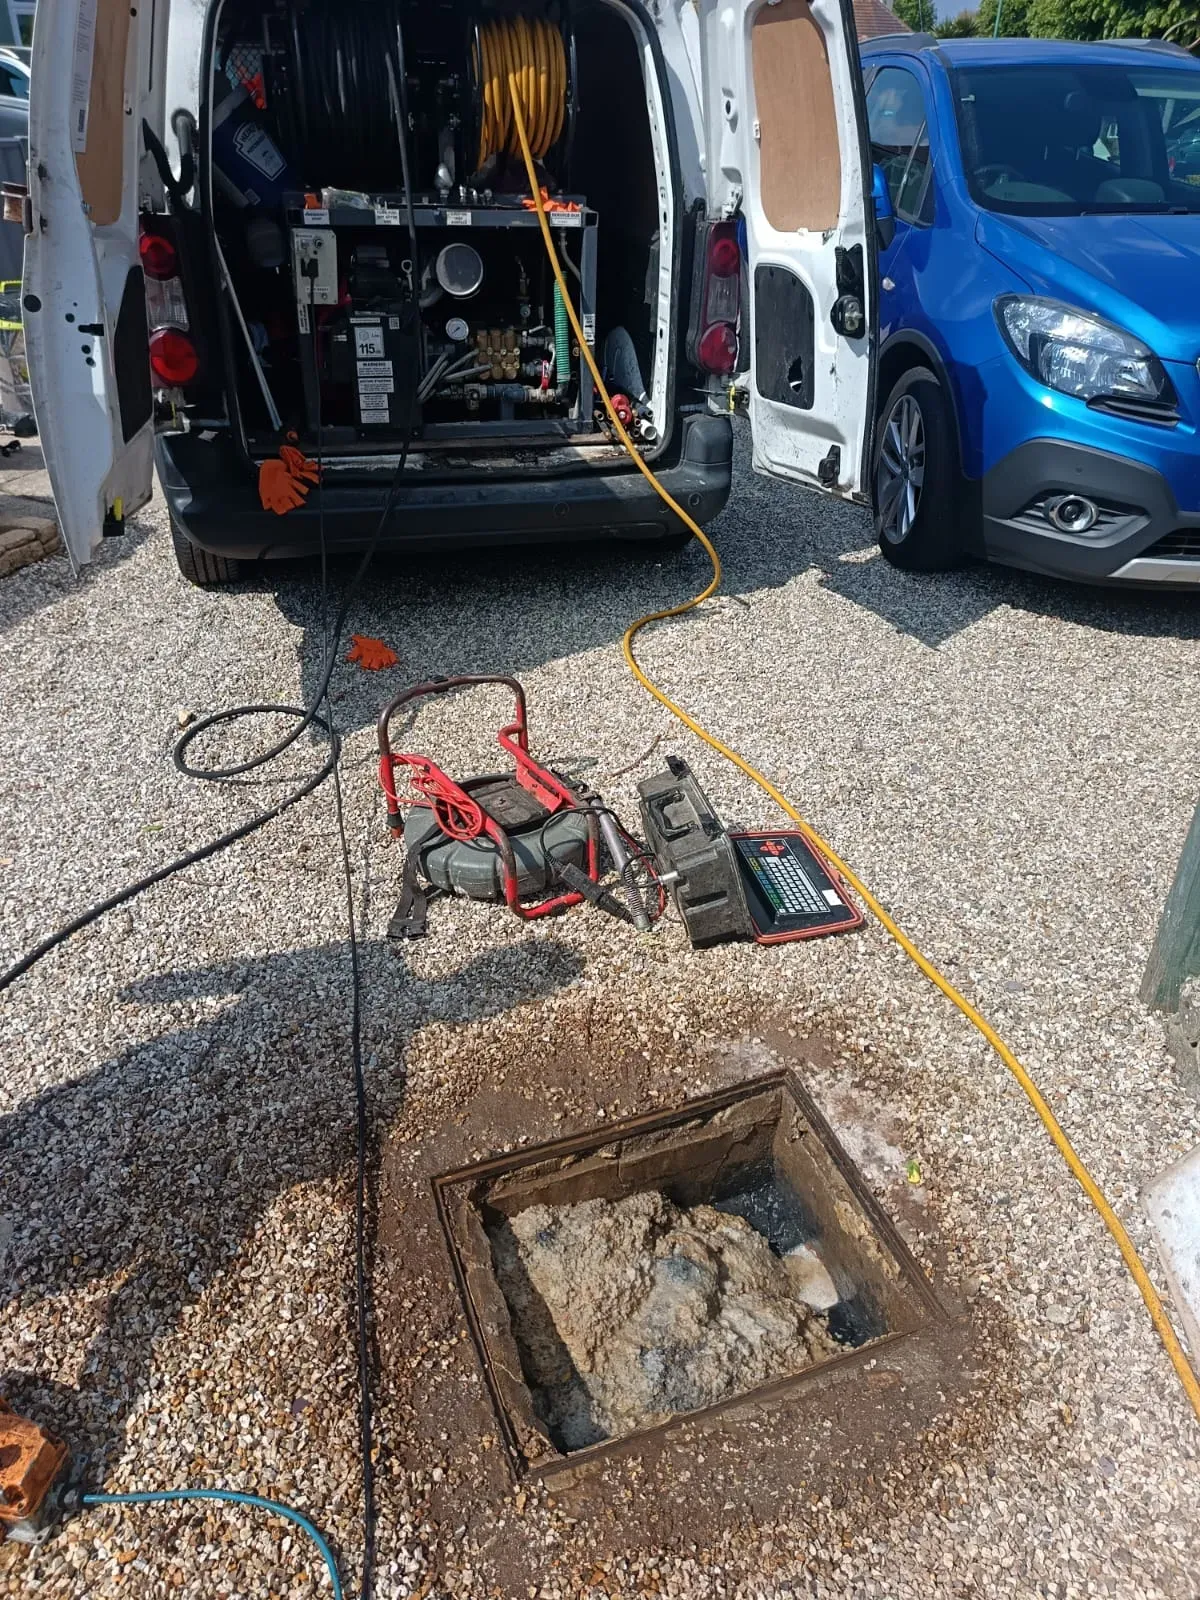
The pressure in the figures above is the same pressure we are called out to. Every photograph below is our own, taken on drainage jobs in the areas this report covers.
What you can do
None of this data changes who is responsible for what, but it does help residents in the worst-affected postcodes make a more informed decision about their own drains. If your street shows up near the top of the flooding table above, or sits in one of the harder-hit spill constituencies, a few precautions are worth more there than elsewhere:
- Keep gullies and grates outside your property clear of leaves and debris, especially before autumn and winter, since a blocked gully sends rainwater straight to the nearest low point instead of into the drainage system.
- Fit a non-return valve on any drain that has flooded internally before. It won't stop the sewer surcharging, but it stops that surcharge coming back up into your property.
- If you're buying or renting in one of the higher-incident districts above, ask for the drains to be checked before you complete. It's a small cost against the risk of inheriting a pre-existing blockage or a shared drain in poor condition.
- Report internal flooding to Thames Water directly, as well as to your insurer. Each report feeds into the same DG5 register this data comes from, and a documented history for a specific street is one of the things that can eventually justify network investment.
Methodology
Sewage spills: Environment Agency data
Spill counts and durations are taken from the Environment Agency's Event Duration Monitoring (EDM) annual return for 2025, the official dataset every water company must report, as compiled and mapped by Top of the Poops. Figures cover monitored Combined Sewage Overflows within each 2024 parliamentary constituency in our service area. A spill is one discrete discharge event; hours are the total monitored duration. Sites shown as zero were monitored but recorded no discharge. National Thames Water context is from the Environment Agency's 2024 Environmental Performance Assessment.
Sewer flooding: Thames Water EIR request
The request. Sent 10 July 2026 to Thames Water's EIR team, reproduced here in full:
The response. Thames Water replied on 29 July 2026 (reference EIR-26-27-335), signed by their Data Protection Advisor, with a spreadsheet covering each postcode area. Addresses were redacted to the first part of the postcode only, which Thames Water cited as required under EIR regulations 12(3) and 13 to protect personal data. Thames Water confirmed the "at risk" register requested in Q3 has not yet been completed.
How we processed it. We used the "Flood Incident Date" field in Thames Water's data (the RiskDate field was blank for most rows) and grouped every incident into the UK financial year it fell in, April to March. Postcode districts were read from the first part of each postcode. Internal and external incidents were identified from Thames Water's FloodLocCode field: "E" for external, "I" for internal. Other codes in that field ("Y", "S", "M", "B", "U") were not explained in Thames Water's response, so we grouped them as unclassified rather than assuming a meaning.
Sources
- Environment Agency — Storm overflow (EDM) spill data, gov.uk
- Top of the Poops — constituency sewage data, 2025 (maps the Environment Agency EDM dataset)
- Thames Water — Storm discharge and flow data
- Environment Agency — Thames Water EPA data report 2024, gov.uk
- Thames Water — EIR response, reference EIR-26-27-335, received 29 July 2026 (obtained directly by Drainage & Plumbing Ltd, not publicly published)
- Full dataset — download the postcode-level sewer flooding CSV compiled from Thames Water's response
- Information Commissioner's Office — Guide to the Environmental Information Regulations, ico.org.uk
Worried about a drain on your property?
We're a local drainage team covering Croydon & Purley, Bromley, Sutton & Carshalton, Epsom and Redhill. If your drains are slow, smelling or backing up, we'll find the cause with a fixed price agreed before we start, no call-out fee.
Get a fixed-price quote