
Blocked Gullies Across Surrey: The 2022–2025 Council Data Report
A blocked gully is the commonest drainage fault on any British road, and almost nobody publishes how often it happens. We asked Surrey County Council, under the Freedom of Information Act, for every report the public made about a blocked gully, a blocked drain or drainage flooding over three financial years. It sent back 18,463 of them, one row per report, with the street and date attached.
Every figure on this page is counted from the row-level spreadsheet Surrey County Council sent us, not from a summary. All 19 columns of it are used below: the date, the financial year, the district, the town, the electoral division, the street reference, the service category, the subject category, the case status and the map coordinates. The council also sent three summary workbooks, and we recounted the raw rows against both of them — the yearly totals and all 82 electoral-division totals match exactly, which is how we know the response is complete rather than a sample.
- What a blocked gully actually is
- Three years, month by month
- When gullies block
- Every Surrey district
- Town by town, all 40 busiest
- Ward by ward
- The map
- The 30 worst streets
- Why a tenth of streets carry half the problem
- What the reports were about
- Who is responsible for the gully outside your house
- Methodology and limitations
What a blocked gully actually is
A gully is the grated opening at the kerb that takes rainwater off the road surface. Under the grate sits a pot, usually 300 to 450 mm deep, designed to catch silt and leaves before the water passes into the drainage pipe. That trap is the point of the design and it is also the reason gullies block: once the pot fills with silt, leaf litter or grit, there is nowhere for the debris to settle and the next fall of rain has no route off the carriageway.
A blocked gully announces itself the same way every time. Water stands against the kerb after rain instead of draining within a few minutes. The grate itself may look clear, because the blockage is below it. In winter that standing water freezes; in summer it sits and smells. If the blockage is in the pipe rather than the pot, the water can back up and surface some distance away, which is why the street that floods is not always the street with the fault.
Surrey County Council is the highway authority for the county, so the gullies on almost every public road in Surrey are its responsibility to maintain. What follows is three years of the public telling it that they are not draining.
Three years, month by month
Reports rose 29.8% between 2022/23 and 2023/24, then fell 16.1% the year after. Across the full three years the net change is +8.8%. Plotted by month rather than by year, the reason is obvious: this is not a trend, it is weather. November 2022 alone produced 1,524 reports, more than the whole of the quietest six months put together.
When gullies block
66.1% of all 18,463 reports arrive in the six months from October to March. November brings 3,087 of them against 643 in June, a factor of 4.8. Leaf fall is the mechanism: a gully pot that has coped all summer fills in a fortnight, and the first sustained rain after that has nowhere to go.
All three financial years combined, grouped by the calendar month the report was received.
Every Surrey district
Guildford logged the most of any district, 2,874 reports or 15.6% of the county total. The gap between the top and bottom district is wide, but so is the gap in road mileage and population, so read these as workload rather than as a league table of drainage quality.
| District | 2022/23 | 2023/24 | 2024/25 | 3-year total | Share | Change |
|---|---|---|---|---|---|---|
| Guildford | 810 | 959 | 1,105 | 2,874 | 15.6% | +36.4% |
| Waverley | 915 | 1,055 | 813 | 2,783 | 15.1% | -11.1% |
| Tandridge | 729 | 1,080 | 730 | 2,539 | 13.8% | +0.1% |
| Reigate & Banstead | 472 | 802 | 688 | 1,962 | 10.6% | +45.8% |
| Elmbridge | 533 | 674 | 467 | 1,674 | 9.1% | -12.4% |
| Mole Valley | 358 | 579 | 514 | 1,451 | 7.9% | +43.6% |
| Spelthorne | 460 | 482 | 340 | 1,282 | 6.9% | -26.1% |
| Runnymede | 364 | 468 | 320 | 1,152 | 6.2% | -12.1% |
| Woking | 371 | 340 | 371 | 1,082 | 5.9% | +0.0% |
| Surrey Heath | 284 | 399 | 395 | 1,078 | 5.8% | +39.1% |
| Epsom & Ewell | 156 | 229 | 168 | 553 | 3.0% | +7.7% |
A further 33 reports carry no district, filed as "No Area Allocated" or outside the council's area. They are counted in the county total but not in this table.
The same shape in almost every district
The 2023/24 spike appears in nine of the eleven districts at once. Two do not follow it: Woking, which is almost flat across all three years, and Guildford, which is the only district where reports rose in every single year.
Town by town
Surrey County Council logged reports against 175 named towns and villages. Woking tops the list with 1,226. 50 places passed 100 reports over the three years; 33 had fewer than ten.
| # | Town | District | 2022/23 | 2023/24 | 2024/25 | Total |
|---|---|---|---|---|---|---|
| 1 | Woking | Woking | 379 | 404 | 443 | 1,226 |
| 2 | Guildford | Guildford | 351 | 361 | 402 | 1,114 |
| 3 | Godalming | Waverley | 310 | 342 | 296 | 948 |
| 4 | Farnham | Waverley | 274 | 362 | 251 | 887 |
| 5 | Camberley | Surrey Heath | 134 | 165 | 209 | 508 |
| 6 | Caterham | Tandridge | 108 | 231 | 88 | 427 |
| 7 | Walton-On-Thames | Elmbridge | 140 | 151 | 129 | 420 |
| 8 | Cranleigh | Waverley | 128 | 121 | 109 | 358 |
| 9 | Sunbury On Thames | Spelthorne | 105 | 107 | 132 | 344 |
| 10 | Horley | Reigate & Banstead | 93 | 129 | 109 | 331 |
| 11 | Haslemere | Waverley | 119 | 136 | 70 | 325 |
| 12 | Cobham | Elmbridge | 111 | 148 | 62 | 321 |
| 13 | Redhill | Reigate & Banstead | 61 | 144 | 110 | 315 |
| 14 | Staines-Upon-Thames | Spelthorne | 103 | 146 | 62 | 311 |
| 15 | Reigate | Reigate & Banstead | 84 | 106 | 111 | 301 |
| 16 | Epsom | Epsom & Ewell | 70 | 116 | 102 | 288 |
| 17 | Chertsey | Runnymede | 82 | 121 | 77 | 280 |
| 18 | Ashford | Spelthorne | 116 | 90 | 64 | 270 |
| 19 | Weybridge | Elmbridge | 93 | 82 | 92 | 267 |
| 20 | Whyteleafe | Tandridge | 54 | 160 | 50 | 264 |
| 21 | Esher | Elmbridge | 81 | 97 | 75 | 253 |
| 22 | Leatherhead | Mole Valley | 69 | 106 | 76 | 251 |
| 23 | Addlestone | Runnymede | 74 | 87 | 68 | 229 |
| 24 | Oxted | Tandridge | 68 | 85 | 72 | 225 |
| 25 | Shepperton | Spelthorne | 75 | 86 | 57 | 218 |
| 26 | Merstham | Reigate & Banstead | 41 | 82 | 95 | 218 |
| 27 | Ashtead | Mole Valley | 65 | 97 | 45 | 207 |
| 28 | Ash Vale | Guildford | 46 | 76 | 70 | 192 |
| 29 | Banstead | Reigate & Banstead | 38 | 85 | 69 | 192 |
| 30 | Egham | Runnymede | 64 | 87 | 41 | 192 |
| 31 | Lingfield | Tandridge | 63 | 58 | 63 | 184 |
| 32 | Dorking | Mole Valley | 43 | 71 | 68 | 182 |
| 33 | West Horsley | Guildford | 70 | 44 | 42 | 156 |
| 34 | Tadworth | Reigate & Banstead | 50 | 58 | 41 | 149 |
| 35 | Ash | Guildford | 37 | 41 | 70 | 148 |
| 36 | East Horsley | Guildford | 16 | 41 | 91 | 148 |
| 37 | Godstone | Tandridge | 45 | 63 | 39 | 147 |
| 38 | Englefield Green | Runnymede | 42 | 58 | 45 | 145 |
| 39 | Warlingham | Tandridge | 28 | 73 | 39 | 140 |
| 40 | Thames Ditton | Elmbridge | 34 | 58 | 41 | 133 |
The 40 busiest of 175. 22 towns straddle a district boundary; the district shown is the one most of that town's reports fall in.
Ward by ward
Surrey attaches an electoral division to each report, which is a finer grain than district and maps onto the county councillor who would raise it. Horsleys leads with 589 reports, against a median across all 82 divisions of 201.
| # | Electoral division | Reports |
|---|---|---|
| 1 | Horsleys | 589 |
| 2 | Lingfield | 571 |
| 3 | Caterham Valley | 529 |
| 4 | Oxted | 512 |
| 5 | Worplesdon | 491 |
| 6 | Waverley Eastern Villages | 489 |
| 7 | Godstone | 473 |
| 8 | Dorking Rural | 405 |
| 9 | Shalford | 398 |
| 10 | Godalming South, Milford and Witley | 379 |
| 11 | Haslemere | 335 |
| 12 | Waverley Western Villages | 334 |
| 13 | Bagshot, Windlesham and Chobham | 330 |
| 14 | Shere | 326 |
| 15 | Cranleigh and Ewhurst | 310 |
| 16 | Foxhills, Thorpe and Virginia Water | 281 |
| 17 | Ash | 266 |
| 18 | Farnham South | 264 |
| 19 | Dorking Hills | 263 |
| 20 | Woking South | 260 |
| 21 | Lower Sunbury and Halliford | 253 |
| 22 | Tadworth, Walton and Kingswood | 252 |
| 23 | Guildford South West | 245 |
| 24 | Cobham | 244 |
Top 25 of 82. A further 416 reports are filed under "Unknown (no co-ordinates)" and cannot be placed in a division.
The map
18,060 of the 18,463 reports (97.8%) carry an Ordnance Survey grid reference, so they can be placed exactly. Each square below is 1.5 km across and shaded by how many reports fell inside it. The darkest cells are the ones worth knowing about: the busiest single square holds 228 reports.
Plotted directly on the Ordnance Survey National Grid from the easting and northing in the council's data, across 702 occupied cells. Purple markers are the ten worst streets from the table below.
The 30 worst streets in Surrey
Streets are identified by USRN, the national street reference, rather than by name: there are dozens of High Streets in Surrey and grouping by name alone would merge them into one meaningless row. Godstone Road in Whyteleafe tops the list with 76 reports in three years, roughly one every 14 days.
| # | Street | Town | District | 2022/23 | 2023/24 | 2024/25 | Total |
|---|---|---|---|---|---|---|---|
| 1 | Godstone Road | Whyteleafe | Tandridge | 19 | 43 | 14 | 76 |
| 2 | Battlebridge Lane | Merstham | Reigate & Banstead | 0 | 24 | 48 | 72 |
| 3 | East Lane | West Horsley | Guildford | 27 | 13 | 23 | 63 |
| 4 | Honeycrock Lane | Salfords | Reigate & Banstead | 15 | 23 | 23 | 61 |
| 5 | Stafford Road | Caterham | Tandridge | 22 | 21 | 14 | 57 |
| 6 | Old Woking Road | Woking | Woking | 32 | 10 | 10 | 52 |
| 7 | Elmbridge Road | Cranleigh | Waverley | 42 | 3 | 5 | 50 |
| 8 | Whyteleafe Hill | Whyteleafe | Tandridge | 13 | 30 | 5 | 48 |
| 9 | Frog Grove Lane | Wood Street Village | Guildford | 14 | 18 | 13 | 45 |
| 10 | Monkton Lane | Farnham | Waverley | 33 | 5 | 6 | 44 |
| 11 | Court Bushes Road | Whyteleafe | Tandridge | 11 | 19 | 13 | 43 |
| 12 | Vale Road | Ash Vale | Guildford | 2 | 20 | 20 | 42 |
| 13 | Ockham Road South | East Horsley | Guildford | 5 | 10 | 27 | 42 |
| 14 | Hersham Road | Walton-On-Thames | Elmbridge | 18 | 12 | 11 | 41 |
| 15 | West Street | Reigate | Reigate & Banstead | 15 | 23 | 2 | 40 |
| 16 | Sturt Road | Camberley | Surrey Heath | 20 | 15 | 4 | 39 |
| 17 | Station Lane | Godalming | Waverley | 12 | 11 | 16 | 39 |
| 18 | Station Avenue | Walton-On-Thames | Elmbridge | 4 | 11 | 23 | 38 |
| 19 | Old Farm Place | Ash Vale | Guildford | 33 | 3 | 2 | 38 |
| 20 | Hillbury Road | Warlingham | Tandridge | 1 | 34 | 3 | 38 |
| 21 | High Street | Ripley | Guildford | 19 | 10 | 8 | 37 |
| 22 | Randalls Road | Leatherhead | Mole Valley | 5 | 13 | 19 | 37 |
| 23 | Brighton Road | Horley | Reigate & Banstead | 10 | 15 | 12 | 37 |
| 24 | Tandridge Lane | Tandridge | Tandridge | 16 | 14 | 6 | 36 |
| 25 | Station Approach | Horley | Reigate & Banstead | 15 | 15 | 5 | 35 |
| 26 | Kingston Road | Staines-Upon-Thames | Spelthorne | 13 | 16 | 6 | 35 |
| 27 | Antlands Lane | Shipley Bridge | Tandridge | 26 | 6 | 3 | 35 |
| 28 | Walnut Tree Close | Guildford | Guildford | 9 | 15 | 10 | 34 |
| 29 | Green Dene | East Horsley | Guildford | 1 | 6 | 27 | 34 |
| 30 | Kingston Road | Leatherhead | Mole Valley | 16 | 11 | 7 | 34 |
Why a tenth of streets carry half the problem
This is the most useful pattern in the data. Reports are not spread evenly across Surrey's 4,436 streets. They concentrate, hard.
| Reports on that street | Streets | % of streets | Reports | % of reports |
|---|---|---|---|---|
| 1 | 1,802 | 40.6% | 1,802 | 9.8% |
| 2-4 | 1,470 | 33.1% | 3,962 | 21.5% |
| 5-9 | 687 | 15.5% | 4,469 | 24.2% |
| 10-19 | 362 | 8.2% | 4,835 | 26.2% |
| 20-39 | 100 | 2.3% | 2,619 | 14.2% |
| 40+ | 15 | 0.3% | 776 | 4.2% |
- 1,802 streets (40.6%) were reported exactly once in three years, and account for 9.8% of all reports.
- 477 streets (10.8%) were reported ten times or more, and account for 44.6% of them.
- 15 streets were reported forty times or more — that is roughly one report a month, for three years, on the same stretch of road.
What the reports were about
Surrey files each report under a service and a subject. 44.4% went in under Blocked Drain, which is the category covering gullies and highway drains, 41.9% under Carriageway and Footway, and 13.3% under Flood.
The mix shifted over the three years
Blocked Drain reports rose steadily while Carriageway and Footway reports peaked in 2023/24 and then fell by a third. The total came down; the blocked-gully share of it did not.
Subject categories
Beneath the service category sits a subject field with 12 values. It is messier — "Other" is the second largest and "Unknown" appears in its own right — but it is the only place the data distinguishes silt from leaves, or a road flood from a property flood.
| Subject | Reports | Share |
|---|---|---|
| CW - flooding | 7,356 | 39.8% |
| Other | 7,173 | 38.9% |
| Flooding Incidents | 1,330 | 7.2% |
| Flooding enquiry | 917 | 5.0% |
| Unknown | 532 | 2.9% |
| Property flood - intern/extern | 392 | 2.1% |
| Soil/Silt | 260 | 1.4% |
| Rubbish/Leaves | 233 | 1.3% |
| FW - flooding | 199 | 1.1% |
| Major flooding across road | 51 | 0.3% |
| Defect - flooding | 19 | 0.1% |
| Flood defect - unknown cause | 1 | 0.0% |
What happened to them
99.9% of all records are marked closed under one of 25 distinct status values. That tells you the case was ended, not that anything was dug up: the field distinguishes several kinds of closure but never records whether physical work took place.
| Status | Reports | Share |
|---|---|---|
| Closed | 9,114 | 49.4% |
| Closed:Final response to cust* | 7,984 | 43.2% |
| Closed:Final response to Cllr* | 508 | 2.8% |
| Closed: Chaser resolved* | 396 | 2.1% |
| Job Complete | 220 | 1.2% |
| Closed: P4 Found- No Works req | 61 | 0.3% |
| Closed: Temp fix already made | 47 | 0.3% |
| Closed: Works already complete | 42 | 0.2% |
The eight commonest of 25 status values.
Who is responsible for the gully outside your house
Three different organisations own three different parts of the same puzzle, and getting the wrong one is the commonest reason a drainage problem drags on for months.
Water standing in the road is the council's. A gully outside your gate that never clears is the council's. But a drain in your garden that backs up, a slow toilet, or a smell of sewage in the house sits on your side of the line, and reporting it to the council will not get it fixed. The symptoms overlap enough that people routinely report the wrong one: a gully that overflows and a private drain that cannot take the run-off produce the same puddle in the same place. Having the pipe itself checked settles it in about an hour by showing which pipe the water is actually failing to leave.
The sewer side of the same region is covered in our companion report, Sewer Flooding Across South London & Surrey, 2022–2025, built from Thames Water's own incident register under the Environmental Information Regulations.
If the gully outside your house is blocked
- Report it, even if you assume someone else has. Every row in this dataset is a logged report, and streets with a documented history are the ones that get scheduled work rather than a reactive visit.
- Clear the grate before autumn, not during it. Sweeping leaves off the top of a grate takes a minute in September. Once they are compacted into the pot by rain, it takes a jetting unit.
- Do not lift a gully grate yourself. They are heavier than they look, they sit in a live carriageway, and the pot below can be a metre deep.
- If water pools against your own boundary every winter, check your side too. A council gully at capacity and a private drain in poor condition look identical from the pavement.
- Buying on one of the streets in the table above? Ask for a drain survey before you complete. The public record tells you about the road; it tells you nothing about the pipe under the garden.
Telling the two apart
A council gully and a private drain chamber can look identical from a metre away. Here is what each actually looks like.
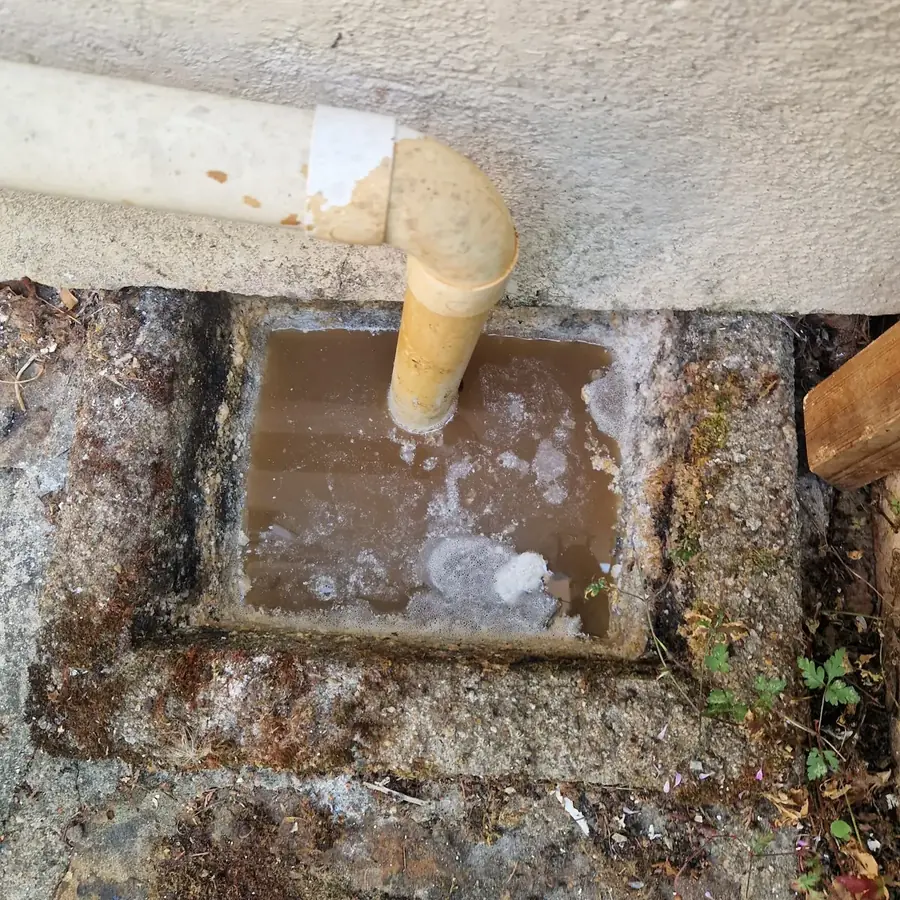
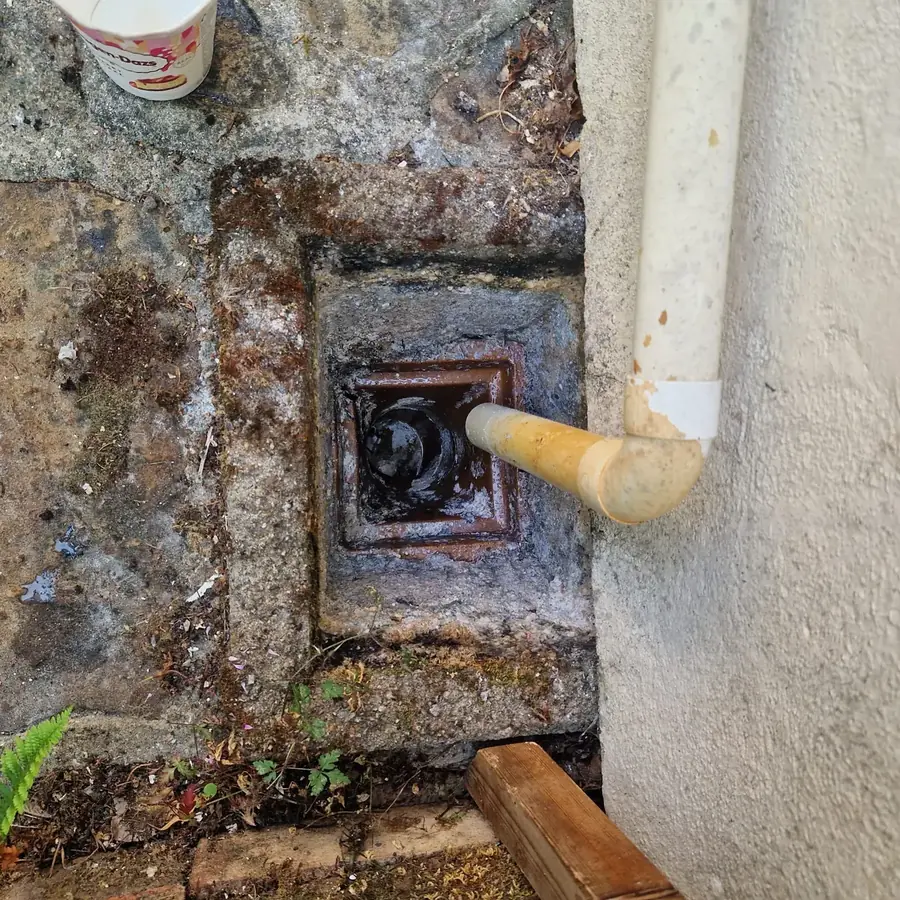
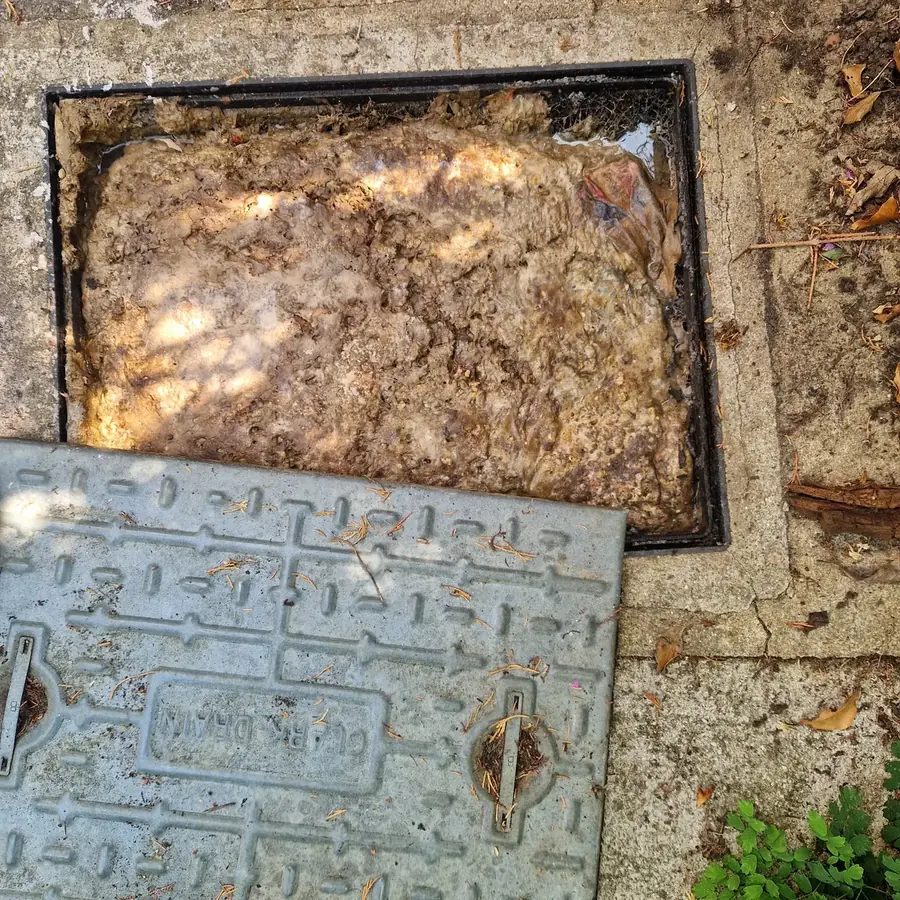
The five districts we cover — Tandridge, Reigate & Banstead, Mole Valley, Elmbridge, Epsom & Ewell — account for 8,179 of the 18,463 reports, 44.3% of the county total.
Methodology
The request. Made to Surrey County Council under the Freedom of Information Act 2000, reference 15003481, covering the financial years 2022/23, 2023/24 and 2024/25:
Surrey County Council wrote on 14 July 2026 asking for the requester's full name, as section 8(1)(b) of the Act entitles it to. The request was confirmed in the name of Nima Fazlipour, director of Drainage & Plumbing Ltd, and proceeded as originally worded.
The response. Four Excel workbooks, compiled by the council's highways data team on 5 and 6 August 2026. The main one holds 18,463 rows and 19 columns: electoral division, enquiry number, date received, financial year, current status, Zendesk id, enquiry reference, easting, northing, USRN, road, town, district, job number, defect number, subject name, service name, service code and subject code. Three further workbooks aggregate the same data by financial year, by electoral division, and by the top ten roads in each year.
Checking it. We recounted the 18,463 raw rows and compared them against the council's own summaries. The three financial-year totals match exactly. All 82 electoral-division totals match exactly. No enquiry number appears twice. The date range runs from 2022-04-01 to 2025-03-31, which is precisely the three financial years requested with nothing missing at either end.
How we processed it. Reports are grouped into UK financial years, 1 April to 31 March, on the date the enquiry was received. Street identity is the USRN, not the street name. District and electoral division are the council's own fields. The map is plotted straight from the easting and northing on the Ordnance Survey National Grid, with no coordinate conversion, in 1.5 km cells. Percentages are calculated against all 18,463 rows unless the text says otherwise.
- These are reports, not verified faults. A street with more reports may have worse drainage, or simply more residents who pick up the phone. Nothing in the dataset records whether an inspection found anything.
- Parts 3 and 4 of the request were not answered. The workbooks contain no gully inventory, no cleansing counts, and no resolution times. There is no closure-date field of any kind, only a date received, so the average time to fix a blocked gully in Surrey cannot be calculated from this release at all.
- Job and defect numbers are almost entirely empty — populated on 279 and 30 rows respectively out of 18,463. They cannot be used to tell which reports led to actual works.
- 403 rows carry no usable grid reference and 416 are filed under the electoral division "Unknown (no co-ordinates)". They are included in district, town and street totals wherever those fields are populated, but they do not appear on the map.
- Surrey County Council is not the authority for every road in Surrey. Motorways and trunk roads belong to National Highways, and private and unadopted roads belong to their owners. None of those appear here.
- Nothing here covers the foul sewer. Sewer flooding is the water company's record, not the council's, and is a separate dataset.
Sources
- Surrey County Council — Freedom of Information response, reference 15003481, workbooks compiled 5 and 6 August 2026 (obtained directly by Drainage & Plumbing Ltd, not publicly published)
- Street-level dataset — download the CSV, all 4,436 streets with per-year counts
- District dataset — download the CSV, per-district per-year counts
- Information Commissioner's Office — Guide to Freedom of Information, ico.org.uk
- Companion report — Sewer Flooding Across South London & Surrey, 2022–2025, from Thames Water's incident register
A drain on your property that keeps blocking?
We're a local drainage team covering Epsom, Redhill and the wider Surrey and South London area. If your drains are slow, smelling or backing up, we'll find the cause with a fixed price agreed before we start, and no call-out fee.
Get a fixed-price quote